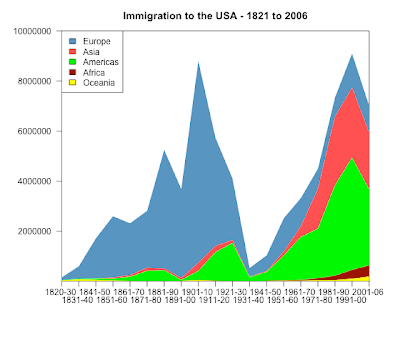
The data are c & p from here:
>original
     Europe    Asia Americas Africa Oceania
1820-30   106487      36    11951     17   33333
1831-40   495681      53    33424     54   69911
1841-50  1597442     141    62469     55   53144
1851-60  2452577   41538    74720    210   29169
1861-70  2065141   64759   166607    312   18005
1871-80  2271925  124160   404044    358   11704
1881-90  4735484   69942   426967    857   13363
1891-00  3555352   74862    38972    350   18028
1901-10  8056040  323543   361888   7368   46547
1911-20  4321887  247236  1143671   8443   14574
1921-30  2463194  112059  1516716   6286    8954
1931-40   347566   16595   160037   1750    2483
1941-50   621147   37028   354804   7367   14693
1951-60  1325727  153249   996944  14092   25467
1961-70  1123492  427642  1716374  28954   25215
1971-80   800368 1588178  1982735  80779   41254
1981-90   761550 2738157  3615225 176893   46237
1991-00  1359737 2795672  4486806 354939   98263
2001-06  1073726 2265696  3037122 446792  185986
png("immigration_log_scatter_BW.png", width = 560, height = 480)
par( mar=c(7, 7, 3, 3) )
plot( original$Europe, log="y", type="l", col="grey20", lty=1,
ylim=c(10, 10000000), xlab="Year Interval", ylab="Number of Immigrants Admitted to the United States",
lwd=2, xaxt='n', yaxt='n', mgp=c(4.5,1,0) ) # xaxt='n' an d yaxt='n'- do not show x and y axis
for (i in 2:dim(original)[[2]]){
lines(original[, i], type="l", lty=i, col="grey20")
}
axis(1, 1:dim(original)[[1]], rownames(original), las=2)
axis(2, at=c(10,100,1000,10000,100000,1000000,10000000), labels=c(10,100,1000,10000,100000,1000000,10000000), las=2, tck=1, col="grey85")
box()
legend( 14,400, legend=colnames(original), lty=c(1:5) )
dev.off()png("immigration_stacked_chart.png", width = 560, height = 480)
library(plotrix)
par( mar=c(6, 6, 3, 3) , las=1)
colori4<-c("yellow", "darkred","green","brown1", "steelblue")
stackpoly( original[, 5:1], col=smoothColors(colori4), border=NA,stack=T, xaxlab=rownames(original),
ylim=c(10,10000000), staxx=TRUE, axis4=F, main="Immigration to the USA - 1821 to 2006" )
legend("topleft", legend=colnames(original), fill=smoothColors(colori4)[5:1] )
dev.off()

Did you see my solution there? :-)
RispondiElimina#-------------------------------#
x <- structure(c(106487, 495681, 1597442, 2452577,
2065141, 2271925, 4735484, 3555352, 8056040, 4321887, 2463194,
347566, 621147, 1325727, 1123492, 800368, 761550, 1359737,
1073726, 36, 53, 141, 41538, 64759, 124160, 69942, 74862,
323543, 247236, 112059, 16595, 37028, 153249, 427642, 1588178,
2738157, 2795672, 2265696, 11951, 33424, 62469, 74720, 166607,
404044, 426967, 38972, 361888, 1143671, 1516716, 160037,
354804, 996944, 1716374, 1982735, 3615225, 4486806, 3037122,
17, 54, 55, 210, 312, 358, 857, 350, 7368, 8443, 6286, 1750,
7367, 14092, 28954, 80779, 176893, 354939, 446792, 33333,
69911, 53144, 29169, 18005, 11704, 13363, 18028, 46547, 14574,
8954, 2483, 14693, 25467, 25215, 41254, 46237, 98263, 185986),
.Dim = c(19, 5), .Dimnames = list(c("1820-30", "1831-40",
"1841-50", "1851-60", "1861-70", "1871-80", "1881-90",
"1891-00", "1901-10", "1911-20", "1921-30", "1931-40",
"1941-50", "1951-60", "1961-70", "1971-80", "1981-90",
"1991-00", "2001-06"), c("Europe", "Asia", "Americas",
"Africa", "Oceania")))
options(scipen = 7)
# pdf("immigration.pdf")
par(mar = c(2.5, 5, 0.1, 0.7), las = 1)
palette(apply(col2rgb(palette("default"))/255, 2,
function(x) rgb(x[1], x[2], x[3], alpha = 0.1)))
matplot(x, type = "l", lty = 1, lwd = 5, log = "y",
axes = FALSE, ylab = "")
axis(1, 1:nrow(x), rownames(x))
axis(2, 10^(pretty(log10(x))))
palette(apply(col2rgb(palette("default"))/255, 2,
function(x) rgb(x[1], x[2], x[3], alpha = 0.75)))
legend(3, 50, colnames(x), col = 1:ncol(x), lty = 1,
lwd = 5, bty = "n", ncol = 3, text.col = "gray")
for (i in 1:nrow(x)) {
for (j in 1:ncol(x)) {
text(i, x[i, j], ifelse(i == nrow(x), "\\VE", "\\MA"),
srt = ifelse(i == nrow(x), 0, ifelse(x[i + 1, j] >
x[i, j], 45, -135)), vfont = c("serif symbol",
"bold"), cex = 2, col = j)
}
}
text(17, 100, "because...\nshe was there!")
box()
# dev.off()
#-------------------------------#
Yes, I did. I was guessing how you had created it! :-)
RispondiEliminaYiuhi, thanks so much for posting you're code!
By the way, your aniwiki site is terrific!