>original
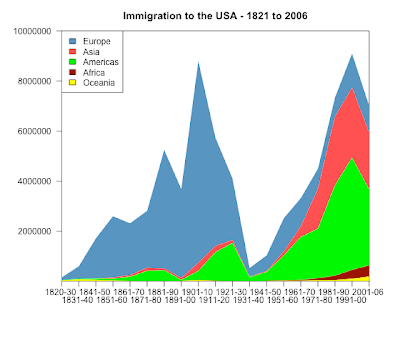
Europe Asia Americas Africa Oceania
1820-30 106487 36 11951 17 33333
1831-40 495681 53 33424 54 69911
1841-50 1597442 141 62469 55 53144
1851-60 2452577 41538 74720 210 29169
1861-70 2065141 64759 166607 312 18005
1871-80 2271925 124160 404044 358 11704
1881-90 4735484 69942 426967 857 13363
1891-00 3555352 74862 38972 350 18028
1901-10 8056040 323543 361888 7368 46547
1911-20 4321887 247236 1143671 8443 14574
1921-30 2463194 112059 1516716 6286 8954
1931-40 347566 16595 160037 1750 2483
1941-50 621147 37028 354804 7367 14693
1951-60 1325727 153249 996944 14092 25467
1961-70 1123492 427642 1716374 28954 25215
1971-80 800368 1588178 1982735 80779 41254
1981-90 761550 2738157 3615225 176893 46237
1991-00 1359737 2795672 4486806 354939 98263
2001-06 1073726 2265696 3037122 446792 185986
png("immigration_barplot_me.png", width = 1419, height = 736)
library(RColorBrewer) # take a look at http://www.personal.psu.edu/cab38/ColorBrewer/ColorBrewer_intro.html
# display.brewer.all()
FD.palette <- c("#984EA3","#377EB8","#4DAF4A","#FF7F00","#E41A1C")
options(scipen=10)
par(mar=c(6, 6, 3, 3), las=2)
data4bp <- t(original[,c(5,4,2,3,1)])
barplot( data4bp, beside=F,col=FD.palette, border=FD.palette, space=1, legend=F, ylab="Number of People", main="Migration to the United States by Source Region (1820 - 2006)", mgp=c(4.5,1,0) )
legend( "topleft", legend=rev(rownames(data4bp)), fill=rev(FD.palette) )
box()
dev.off()I find this 'bubbleplot' visualization quite interesting; unfortunately the R code I was capable to produce is quite poor and unsatisfactory. Any improvement or suggestion is more than welcome!
Anyway, this is the code:
png("immigration_bubbleplot_me.png", width=1400, height=400)
par(mar=c(3, 6, 3, 2), col="grey85")
mag = 0.9
original.vec <- as.matrix(original)
dim(original.vec) <- NULL
symbols( rep(1:nrow(original),ncol(original)), rep(5:1, each=nrow(original)), circles = original.vec, inches=mag, ylim=c(1,6),fg="grey85", bg="grey20", ylab="", xlab="", xlim =range(1:nrow(original)), xaxt="n", yaxt="n", main="Immigration to the USA - 1821 to 2006", panel.first = grid())
axis(1, 1:nrow(original), labels=rownames(original), las=1, col="grey85")
axis(2, 1:ncol(original), labels=rev(colnames(original)), las=1, col="grey85")
dev.off()
You can find the first part of this 'series' with Yihui contributed code (Thanks again!) here.


