martedì 23 dicembre 2008

Statistical Visualizations

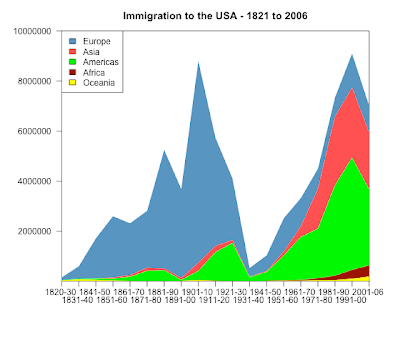
Inspired by this interesting post, I decided to reproduce some of the plots using R code.

The data are c & p from here:

>original
Europe Asia Americas Africa Oceania
1820-30 106487 36 11951 17 33333
1831-40 495681 53 33424 54 69911
1841-50 1597442 141 62469 55 53144
1851-60 2452577 41538 74720 210 29169
1861-70 2065141 64759 166607 312 18005
1871-80 2271925 124160 404044 358 11704
1881-90 4735484 69942 426967 857 13363
1891-00 3555352 74862 38972 350 18028
1901-10 8056040 323543 361888 7368 46547
1911-20 4321887 247236 1143671 8443 14574
1921-30 2463194 112059 1516716 6286 8954
1931-40 347566 16595 160037 1750 2483
1941-50 621147 37028 354804 7367 14693
1951-60 1325727 153249 996944 14092 25467
1961-70 1123492 427642 1716374 28954 25215
1971-80 800368 1588178 1982735 80779 41254
1981-90 761550 2738157 3615225 176893 46237
1991-00 1359737 2795672 4486806 354939 98263
2001-06 1073726 2265696 3037122 446792 185986


png("immigration_log_scatter_BW.png", width = 560, height = 480)
par( mar=c(7, 7, 3, 3) )
plot( original$Europe, log="y", type="l", col="grey20", lty=1,
ylim=c(10, 10000000), xlab="Year Interval", ylab="Number of Immigrants Admitted to the United States",
lwd=2, xaxt='n', yaxt='n', mgp=c(4.5,1,0) ) # xaxt='n' an d yaxt='n'- do not show x and y axis
for (i in 2:dim(original)[[2]]){
lines(original[, i], type="l", lty=i, col="grey20")
}
axis(1, 1:dim(original)[[1]], rownames(original), las=2)
axis(2, at=c(10,100,1000,10000,100000,1000000,10000000), labels=c(10,100,1000,10000,100000,1000000,10000000), las=2, tck=1, col="grey85")
box()
legend( 14,400, legend=colnames(original), lty=c(1:5) )
dev.off()


png("immigration_stacked_chart.png", width = 560, height = 480)
library(plotrix)
par( mar=c(6, 6, 3, 3) , las=1)
colori4<-c("yellow", "darkred","green","brown1", "steelblue")
stackpoly( original[, 5:1], col=smoothColors(colori4), border=NA,stack=T, xaxlab=rownames(original),
ylim=c(10,10000000), staxx=TRUE, axis4=F, main="Immigration to the USA - 1821 to 2006" )
legend("topleft", legend=colnames(original), fill=smoothColors(colori4)[5:1] )
dev.off()


giovedì 11 dicembre 2008

Tips from Jason

I want to thank Jason Vertrees for the following collection of useful tips!

(1) Use ~/.Rprofile for repeated environment initialization

(2) Ever have the problem of a large data frame only being displayed across 40% of your terminal window? Then, you can resize the R display to fit the size of your terminal window. Use the following "wideScreen" function:

# define wideScreen
wideScreen <- function() {
options(width=as.integer(Sys.getenv("COLUMNS")));
}
#
# Test wideScreen
#
a <- rnorm(100)
a
wideScreen()
# notice how the data fill the screen
a


(3) Get familiar with colorspace. For example, if you need to color data points across a range, you can easily do:

##
## lut.R -- small function that returns a cool pallete of nColors
##
require(colorspace)
lut <- function(nColors=20) {
return(hex(HSV(seq(0, 360, length=nColors)[-nColors], 1, 1)));
}
# Now use lut.
plot( rnorm(100), col=lut(100)[1:100] )
# Now use just a range; use colors near purple; pretty
# much like gettins subsections of rainbow.colors()
plot( rnorm(30), col=lut(100)[71:100] )


(4) Given an N-dimensional data set, (m instances in N dimensions), find the K-nearest neighbors to a given row/instance/point:

##
## neighbors -- find and return the K closest neighbors to "home"
##
neighbors <- function( dat, home, k=10 ) {
theHood <- apply( dat, 1, function(x) sqrt(sum((x-home)**2)))
return(order(theHood)[1:k] )
}
# Use it. Create a random 10x10 matrix and find which rows
# in D are closest (Euclidean-wise) to row 1.
d <- matrix( rnorm(100), nrow=10, ncol=10)
neighbors(d, d[1,], k=3)


(5) A _VERY_ useful tip is to show the users the vast difference in speed between using for, apply, sapply, mapply and tapply. A for loop is typically very slow, where the ?apply family is great. You can use the apply vs for-loop in the neighbors function above with a timer on a large set to show the difference.

(6) Another useful tip, also in neighbors is generating difference vectors and their lengths:

# the difference vector between two vectors is very easy,
c <- a -b
# now the vector length (how far apart in Euclidean space these two points are)
sqrt(sum(c**2))

mercoledì 3 dicembre 2008

Retrieving the author of a script

I know that the best/recommended way to manage the authoring of R code consists in building a package containing a DESCRIPTION file.
Nevertheless, I wrote a very basic function retrieving the name of the authors of a script (or any text file) if these names are written within the first three rows of the file (easily changeable) with this format:

##
## Author:Pinco Palla, Paolino Paperino, Topo Gigio
##

The function:

catch.the.name <- function(filename="myscript.R"){
require(gdata)
str <- scan(filename, what='character', nlines=3, sep="\t", quiet=TRUE)
author <- grep("Author:([^ ]+)", str, value=T)
author <-sub('^.*Author:', "", author)
author <-strsplit(author,",")
author <- trim(author)
return(author[[1]])
}