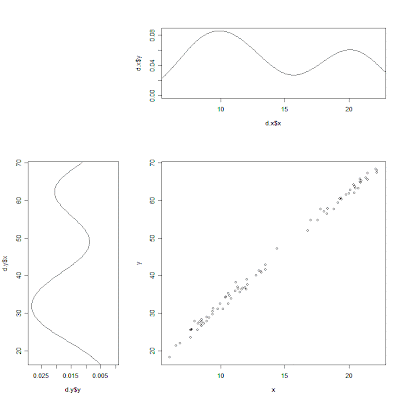
x <- c( rnorm(50,10,2), rnorm(30,20,2) )
y <- 2+3*x + rnorm(80)
d.x <- density(x)
d.y <- density(y)
layout( matrix( c(0,2,2,1,3,3,1,3,3),ncol=3) )
plot(d.x$x, d.x$y, xlim=range(x), type='l')
plot(d.y$y, d.y$x, ylim=range(y), xlim=rev(range(d.y$y)), type='l')
plot(x,y, xlim=range(x), ylim=range(y) )
Nessun commento:
Posta un commento